


THE ARCHITECTURE OF CAPITAL - Part 2

Five Systems, Five Allocation Architectures
How capital architectures determine who builds AI — and who rents it.

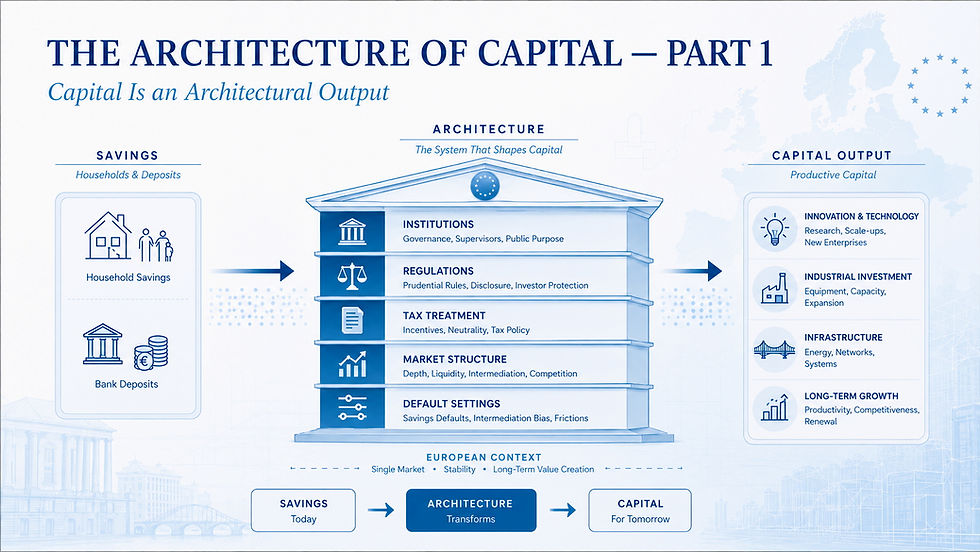
Part 1 argued that capital is an architectural output — that what a system produces depends on how the system is built, and that different architectures select for different things.
This is where that claim gets tested.
Five systems. One question:
Where does large-scale risk capital originate, how does it reach companies, and what dependency does that route create?
Not which system is better. Each of the five has financed things the others could not.
The Comparison
Mechanism | United States | Europe | Japan | South Korea | China |
Institutional and pension capital available for risk allocation | Core | Fragmented — deep in some states, negligible in others | Substantial reserves, conservatively deployed | Very large reserves, high cash weighting in private plans | Not the primary mechanism |
Venture formation | Core | Developing, roughly one-third of US scale | Limited | Moderate | State-guided variant |
Exit and capital-recycling liquidity | Core | Limited, and leaks abroad | Improving via buybacks and governance reform | Improving via governance reform | Not the primary mechanism |
Primary regeneration mechanism | Exit and reinvestment | Deposit and insurance intermediation | Corporate balance-sheet compounding | Conglomerate capital recycling | State-directed credit and policy funds |
The final row is the most important line in this article.
Every system regenerates capital. None of them regenerates it the same way. And the mechanism a system uses determines what it can finance without asking anyone’s permission — which is the whole of the argument that follows.
Metric One: Where Long-Duration Savings Sit
The United States holds the largest pool of retirement capital in the OECD — around $44.8 trillion, roughly 71 per cent of the OECD total. That capital is not idle. It is routed at scale into public equities, while institutional allocators also supply venture funds and private markets.
Europe’s position is more interesting than “smaller,” because Europe is not one system. Pension assets exceed 150 per cent of GDP in Denmark, the Netherlands and Switzerland. In France, Italy and Spain they sit around 11–12 per cent. In Germany, the largest economy in the union, they are in single digits.
That is the fragmentation argument stated numerically. Europe does not have a weak pension architecture. It has several unconnected ones, only some of which produce investable long-duration capital, and no mechanism that pools them.
The consequence shows up precisely where it matters. European pension and endowment allocation to venture capital remains a fraction of the US rate — a gap Atomico’s State of European Tech 2025 sizes at roughly $210 billion of additional capital for European technology over a decade, if allocations simply matched American levels.
Not new savings. The same savings, allocated differently.
Asia inverts the assumption that Europe is uniquely constrained. Korea’s National Pension Fund reserves stand at 47.6 per cent of GDP — the highest ratio in the OECD — with Japan at 42.7 per cent. These are enormous accumulations by any measure.
But accumulation is not deployment. Separately, cash and deposits accounted for 44.8 per cent of Korean pension-plan assets at end-2024, the highest share among reporting OECD countries.
Large reserves and conservative deployment are not a contradiction. They are a selection.
Metric Two: Whether the System Finances Uncertainty
This is the clearest divergence in the entire comparison.
Annual venture capital financing in the EU averaged 0.2 per cent of GDP over 2013–2023, against a US average of 0.7 per cent — less than one-third the scale. Over that decade, US venture funds raised roughly $800 billion more than EU funds. The European industry has fewer funds and smaller funds, and the fragmentation of private capital pools makes large funds difficult to assemble in the first place.
The 2025 figures show the gap holding. US technology funding reached 0.74 per cent of GDP — 0.61 per cent with OpenAI’s outsized round stripped out. The closest European region, the UK and Ireland, reached 0.35 per cent: still less than half.
Here the obvious objection arrives. If European institutions allocate less to venture, perhaps that is rational. Perhaps European risk capital simply returns less.
It does not.
Over a ten-year horizon, the European venture index returned 17.2 per cent — ahead of US venture at 13.1 per cent, US public equities at 13.7 per cent, and European public equities at 7.8 per cent.
European venture capital has outperformed American venture capital for a decade, and European institutions have continued to underallocate to it.
Which establishes the point this series exists to make: the underallocation cannot be explained by realized returns alone. It is a property of the architecture.
China does not appear on this axis in a comparable form, and that absence is examined below.
Metric Three: Whether Success Recycles
This is where the loop either closes or leaks.
The US IPO market in 2026 has been extraordinary. Dealogic counted 194 IPOs through 2 July worth $155.8 billion. SpaceX accounted for $86.2 billion on that methodology, including the fully exercised over-allotment — but even excluding it, $69.9 billion of IPO paper had printed, more than double the same period in 2025.
Europe entered 2026 from a much weaker base. European IPO volume fell 20 per cent in 2025 to 105 deals with proceeds of $17.3 billion, and just 47 European IPOs priced in the first nine months, near a twenty-year low. Momentum improved into 2026 — €4.7 billion across 12 IPOs in Q1, up 47 per cent year on year — but from a very low base.
The result is a single figure that carries the entire argument:
Europe generates 17 per cent of new global enterprise value and captures 10 per cent of exit value.
Global technology exit value in 2025 was around $608 billion. Europe took a tenth of it. More than 40 per cent of European technology exit value is captured abroad.
Europe creates. Europe captures less. And what it does not capture, it cannot recompound.
The relocation data shows the same mechanism from the other side, and the detail matters more than the headline. Around 15 per cent of surveyed European founders have moved their company’s headquarters abroad, with 57 per cent of those going to the United States, and roughly 30 per cent of companies at Series C and later relocate outside Europe.
But the sharpest number concerns which founders leave. Among seasoned founders — those with prior exits, C-suite experience, large raises behind them — the share incorporating in the US has nearly doubled, from 10 per cent to 18 per cent. First-time founders overwhelmingly stay.
That is the regeneration loop leaking at exactly the point where it should compound hardest. The people carrying recycled capital, operating experience and networks are the ones most likely to build the next company somewhere else.
One correction before this is overstated, because the exodus narrative is routinely exaggerated. Companies that have moved represent about 2 per cent of Europe’s listed companies and 4 per cent of their combined value. Nearly 90 per cent of IPOs by European companies over the past decade listed on domestic markets, and only 15 per cent of European technology IPOs by value listed in the US. Around four in five European founders are still building at home, and among AI founders that share has risen.
Europe is not emptying out. Its technology sector is worth close to $4 trillion, roughly 15 per cent of European GDP, four times its value a decade ago.
The problem is narrower and more serious than an exodus: the value that leaves is disproportionately the value that would have regenerated.
The Cells That Are Empty
China does not fit two of the three metrics — and that is the finding, not a gap in the research.
Chinese capital does not travel from household savings through pension allocation into venture funds and back out through exits. It travels a different route entirely: state priorities, policy banks, industrial funds, directed credit, national champions, strategic capacity.
The instruments are explicit. Big Fund III, established in May 2024 with registered capital of ¥344 billion — roughly $47.5 billion — is backed by 19 state stakeholders including the Ministry of Finance and six large state-owned banks, which together committed ¥114 billion, close to a third of the fund. A National Artificial Intelligence Fund followed at ¥60.06 billion, with a thirteen-year investment horizon, directed at computing power, algorithms, data and applications.
For scale: Big Fund III alone exceeds the $39 billion in direct CHIPS Act incentives, against the EU Chips Act at €43 billion and South Korea’s $19 billion support package. These are not directly comparable instruments; the comparison indicates order of magnitude, not financing form.
Now look at what actually supplies that capital.
State-owned banks.
Which produces the most useful comparison in this entire post — because Europe is also bank-intermediated. Both systems route household savings through banking institutions rather than through markets. The institutional form is similar.
The selection is opposite.
European bank intermediation is pointed at preservation. Chinese bank intermediation is pointed at industrial coordination. Same instrument, different instruction, entirely different output.
Which disposes of the lazy conclusion that Europe’s problem is being bank-centric and the remedy is to become more American. China is bank-centric and finances fabs at national scale. The question is never only which institutions a system has. It is what those institutions have been pointed at.
What Each Architecture Selects For
Reading the five systems against the categories:
United States — experimentation. Deep retirement capital routed into equities, the largest venture industry in the world, and an exit market that returns capital to investors who deploy it again. The loop closes fastest here.
Europe — preservation. Enormous savings, fragmented pension architecture, bank and insurance intermediation, thin exit markets. Europe does not lack capital. It lacks a mechanism that reliably converts preservation into experimentation.
Japan — disciplined allocation. Large reserves and strong corporate balance sheets, with capital efficiency now the explicit reform objective.
South Korea — concentrated execution. Very large national pension reserves, conservative private-plan deployment, and industrial capacity concentrated in a small number of groups that allocate internally.
China — industrial coordination. Household savings intermediated by state banks into policy funds with decade-plus horizons, directed at chokepoints rather than at returns.
Selection Is Not Destiny
These are tendencies observed in five systems, not a fixed taxonomy — and two of the five are actively changing what they select for.
Japan is the clearest case. Following the Tokyo Stock Exchange’s push for management conscious of cost of capital and share price, 815 companies — 49 per cent of the Prime section — had disclosed capital efficiency measures or had them under consideration. Cross-shareholdings are unwinding: the three largest insurers have committed to exiting theirs entirely, with proceeds funding buybacks, and the Toyota Group sold ¥935.3 billion of strategic shareholdings in the year to March 2026, cutting its holdings to a third of their level four years earlier. In July 2026 Tokyo went further, finalizing the first revision to its Corporate Governance Code in five years — one that asks boards to justify idle cash and balance-sheet resources against long-term growth rather than let them accumulate by default.
Korea is moving on a parallel track. The Financial Services Commission launched its Corporate Value-Up Program in February 2024, with the Korea Value-Up Index following that October — a hundred companies meeting defined governance criteria. Those companies have since outperformed the broader KOSPI 200 on shareholder return. In July 2025 the Commercial Act was revised to bring shareholders within directors’ duty of loyalty, with further revisions including mandatory treasury-share cancellation.
The relative measure is the one that matters. Korea’s headline index gains over the same period were driven substantially by the AI memory cycle — during which Samsung and SK Hynix came to dominate the index, their combined weight climbing from roughly a quarter of total market capitalization at the end of 2025 to a majority of it during 2026 — so the governance effect is visible in the outperformance of the reform cohort, not in the level of the market.
Both are capital architectures being deliberately re-pointed. Which is the most important observation available to any European reader: if selection can change, architecture is not destiny.
It also sets the standard. Japan and Korea did not close their capital gap by raising more money. They changed the rules governing what existing capital was required to do.
Europe has begun the same work. The Savings and Investments Union is one instrument. The other is the Franco-German FIVE taskforce — Financing Innovative Ventures in Europe — led by former German finance minister Jörg Kukies and former Banque de France governor Christian Noyer, whose final report was presented in January 2026 with recommendations built around deepening the Savings and Investments Union and reforming pension systems to reach European scaleups.
Both are the same species of intervention as Tokyo’s and Seoul’s: rules about what capital is permitted and expected to do.
The question is whether they arrive in time.
What Each System Owes
Every architecture finances something well and something else on borrowed terms.
An architecture built on exit and reinvestment depends on markets staying open, and on the confidence that prices them.
An architecture built on deposit intermediation depends on someone else supplying the risk capital its own layers require.
An architecture built on corporate balance sheets depends on incumbents choosing to reinvest.
An architecture built on conglomerate recycling depends on a small number of groups making the right call.
An architecture built on state-directed credit depends on political priorities remaining correct across a thirteen-year horizon.
None of these obligations appears in any valuation until the day it does. They sit outside the model — unpriced, unrecognized, and entirely real — in the way a contingent liability sits off a balance sheet until it becomes probable enough to book.
Every regeneration mechanism solves one problem.
Every regeneration mechanism creates a contingent liability.
Which raises the question the next part has to answer.
If each system produces a different kind of capital, and each kind of capital can finance some things and not others — then what, exactly, does AI require?
That is Part 3.
RHODES OBSERVATION
Systems do not compete through the capital they hold.
They compete through the architectures that create, allocate, and compound it.
Sources
Where long-duration savings sit
OECD, Pensions at a Glance 2025 and Pension Markets in Focus 2025 (preliminary 2024 data) — US pension assets of roughly $44.8 trillion, about 71 per cent of the OECD total; Korea’s National Pension Fund reserves at 47.6 per cent of GDP and Japan’s at 42.7 per cent (public pension reserve funds); and Korean pension-plan assets holding 44.8 per cent in cash and deposits at end-2024, the highest share among reporting OECD countries.
IMF, Global Financial Safety Net review, 2025, citing OECD Pension Statistics — pension assets above 150 per cent of GDP in Denmark, the Netherlands and Switzerland; around 11–12 per cent in France, Italy and Spain; and single digits in Germany.
Venture formation and returns
IMF, Working Paper WP/24/146 — EU venture capital averaging 0.2 per cent of GDP over 2013–2023 against 0.7 per cent in the US, with US funds raising roughly $800 billion more than EU funds over the decade.
Atomico, State of European Tech 2025 — 2025 US technology funding at 0.74 per cent of GDP (0.61 per cent excluding OpenAI’s round) against 0.35 per cent for the UK and Ireland; a ten-year horizon pooled net return of 17.2 per cent for European venture against 13.1 per cent for US venture, 13.7 per cent for US public equities and 7.8 per cent for European public equities; and roughly $210 billion of additional capital for European technology over a decade if pension and endowment allocations matched US levels.
Exit markets and value capture
ION Analytics / Dealogic, as of 2 July 2026 — 194 US IPOs in 2026 worth $155.8 billion on Dealogic’s transaction-value methodology, of which SpaceX accounted for $86.2 billion (including the fully exercised over-allotment), leaving $69.9 billion excluding it — more than double the same period in 2025.
EY and Bloomberg — European IPO volume down 20 per cent in 2025 to 105 deals worth $17.3 billion, with 47 priced in the first nine months; and Q1 2026 volume of €4.7 billion across 12 IPOs, up 47 per cent year on year.
Atomico, State of European Tech 2025 — Europe generating 17 per cent of new global enterprise value while capturing 10 per cent of exit value; global technology exit value in 2025 of around $608 billion; more than 40 per cent of European tech exit value captured abroad; and a European tech sector worth close to $4 trillion, about 15 per cent of European GDP.
Atomico, State of European Tech 2025 founder survey (2,500+ respondents) — 15 per cent of surveyed founders having moved headquarters abroad, 57 per cent of those to the US; roughly 30 per cent of Series C-and-later companies relocating outside Europe; and the share of seasoned founders incorporating in the US rising from 10 to 18 per cent.
New Financial, A reality check on international listings — relocated companies representing about 2 per cent of European listed companies and 4 per cent of their value; nearly 90 per cent of European IPOs over the past decade listing domestically; and about 15 per cent of European tech IPOs by value listing in the US.
Reform: Japan, Korea and Europe
Tokyo Stock Exchange — 815 companies (49 per cent of the Prime section) disclosing or considering capital-efficiency measures; the three largest insurers committing to exit their cross-shareholdings; and the Toyota Group selling ¥935.3 billion of strategic shareholdings in the year to March 2026, cutting holdings to about a third of their level four years earlier.
Financial Services Agency and Tokyo Stock Exchange, Corporate Governance Code (2026 Revision), finalized 21 July 2026 — the first revision in five years, asking boards to assess continuously whether cash and other balance-sheet resources are being deployed for long-term growth rather than accumulating by default.
Financial Services Commission (Korea) — the Corporate Value-Up Program launched February 2024; the Korea Value-Up Index (100 companies meeting governance criteria) launched October 2024; the July 2025 Commercial Act revision bringing shareholders within directors’ duty of loyalty; and the Value-Up cohort outperforming the KOSPI 200 on shareholder return.
Goldman Sachs and Korea Exchange data, 2026 — Samsung Electronics and SK Hynix, together around a quarter of KOSPI market capitalization at the end of 2025, rising to a majority of it during the 2026 AI-memory surge, with combined weight approaching 60 per cent at the late-June peak, concentrating the headline index gains in the two stocks.
Kukies, J. and Noyer, C., Financing Innovative Ventures in Europe (FIVE), German Federal Ministry of Finance, presented 19 January 2026 — recommendations built around deepening the Savings and Investments Union and reforming pension systems to channel capital to European scaleups.
China’s state-directed architecture
Official corporate filings and China’s Ministry of Industry and Information Technology, 2024–2026 — Big Fund III established May 2024 with registered capital of ¥344 billion (about $47.5 billion), 19 state investors led by the Ministry of Finance and six state-owned banks committing ¥114 billion; a National AI Fund of ¥60.06 billion with a thirteen-year horizon; and, for scale, roughly $39 billion in direct CHIPS Act incentives, the EU Chips Act at €43 billion and South Korea’s $19 billion support package.
AXISYNC Partners LLC
axisyncpartners.net | Architecture of Decision Sovereignty
The Architecture of Capital — Part 2 | August 2026


Comments